Let's face it. Viewing log files is not the most glamorous thing to do. If your company has a high-traffic web site, web server, API, or web anything, someone in your organization has got to do it. And chances are since you are reading this, then that person is probably going to be YOU.
Web servers are configured to log URLs, just as cash registers are designed to spit out unnecessarily long receipts. Unfortunately, that is a sad reality. These receipts are a real problem. For our purposes though, these logs are an invaluable tool in preventing and analyzing attacks especially after the fact. In the case of IIS servers,
logging is turned on by default capturing data in the
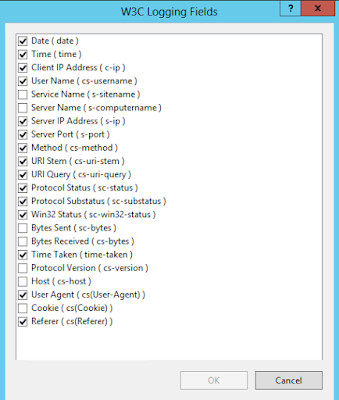
W3C format. This applies to IIS7 and later. IIS logs the following fields under the W3C format, which should be sufficient enough but the option exists to log more. Bytes Sent and Bytes Received seem like good candidates depending on what/how your web applications transmit/receive data.
This means you should wrangle these files, located
%SystemDrive%\inetpub\logs\LogFiles by default, and review them periodically. That may be every hour, every day or every week - whatever makes sense to you and your organization. If you feel it's too infrequent, then it's time to change the very policies that exist to protect your company's data. However, it must be done.
The good news is that you can do this pretty easily using a tool called
Log Parser Studio. It's an easy to use utility that has a number of pre-set queries to show, for example the Top 20 URLs requested. This may be nice for usage metric purposes but we are more concerned with errors and unusual behavior outside of two standard deviations. Look at the data and determine if anything seems suspicious and really look for the outliers. As the motto goes, if you see something, say something.
Haven't reviewed logs before? Not a problem. I would suggest running a number of these pre-defined queries daily in a batch. That way, you can peruse over the data within a few minutes with a few button clicks. A few things you might want to look for in your logs:
- HTTP verbs used
- GET Requests w/sensitive data
- Requests sent over Port 80 that shouldn't have been
Long running queries, errors by error code and requests per hour are nice to see. A couple of things are more interesting here however. IIS: Top 20 HTTP Verbs shows us all the methods used. If you know you don't allow the PUT and DELETE methods but it shows up in the logs, something is wrong. Double check your IIS server for these settings. Better yet, disable all methods including PUT, DELETE, TRACE, CONNECT, OPTIONS and only allow GET POST and HEAD. This may vary from application to application so if you are unsure, ask someone. Also, if you see any GET requests being sent over with sensitive data in the query please take note of it. Furthermore, if you see requests coming in via the unsecured channel (Port 80) but those should be secured then this could be a client explicitly requesting HTTP instead of HTTPS. Determine if there is a pattern and investigate. And last but not least, a good practice might be to check the client IPs that are sending most of the requests. Do a quick search and see which area the requests are being made the most. If you are a local business or do most of your business in a confined geographical area and most of your requests are coming from China or North Korea, that would be a cause for concern.
There are many other ways of dissecting this log data and attackers are only getting smarter. Revisit the strategy of review, data points and other markers that may be a warning sign for hackers. Do this every quarter to stay on top of this perpetual cat and mouse game.
If you are looking for PCI DSS or HIPAA compliance, look into
OSSEC - a host based IDS. It does a lot more than just log inspection, but that's something I will delve into next time. I will create a blog post on it in the near future so stay tuned.


